
Hydroponic PPM Chart, EC and PPM Targets by Crop
Target nutrient strength for every beginner crop, in EC and on both PPM scales, plus the tap water step that quietly throws your numbers out.
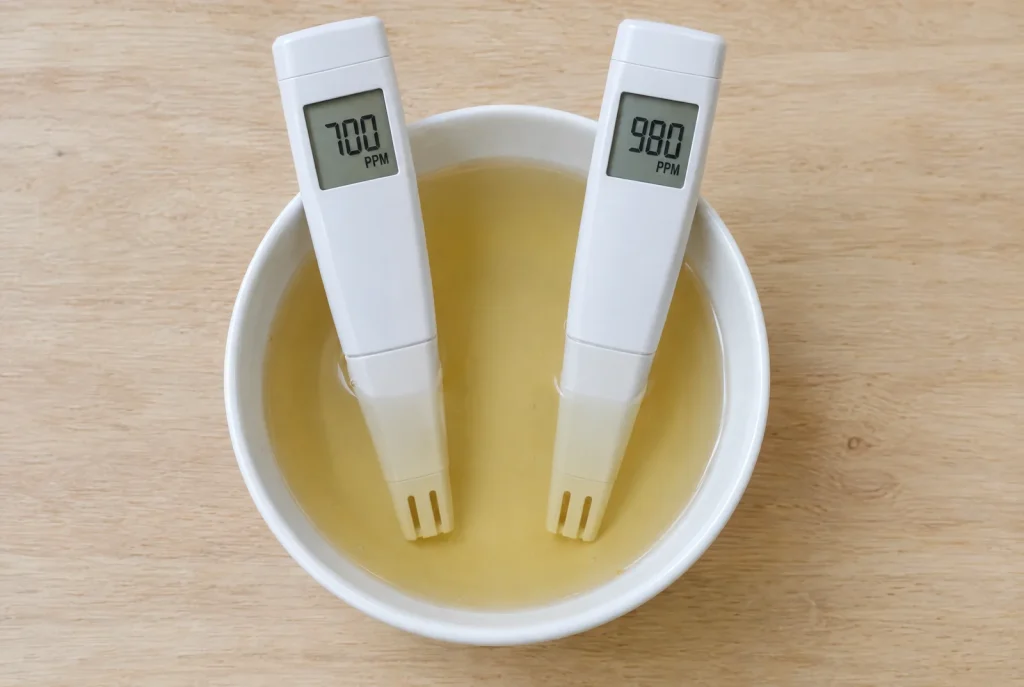
Every hydroponic crop has a nutrient strength it grows best at, and your meter tells you whether you have hit it. The trouble is that two meters can sit in the same bucket and show completely different numbers. This page gives you the target ranges by crop and stage, in EC and in both PPM scales, plus the one adjustment almost nobody tells beginners about.
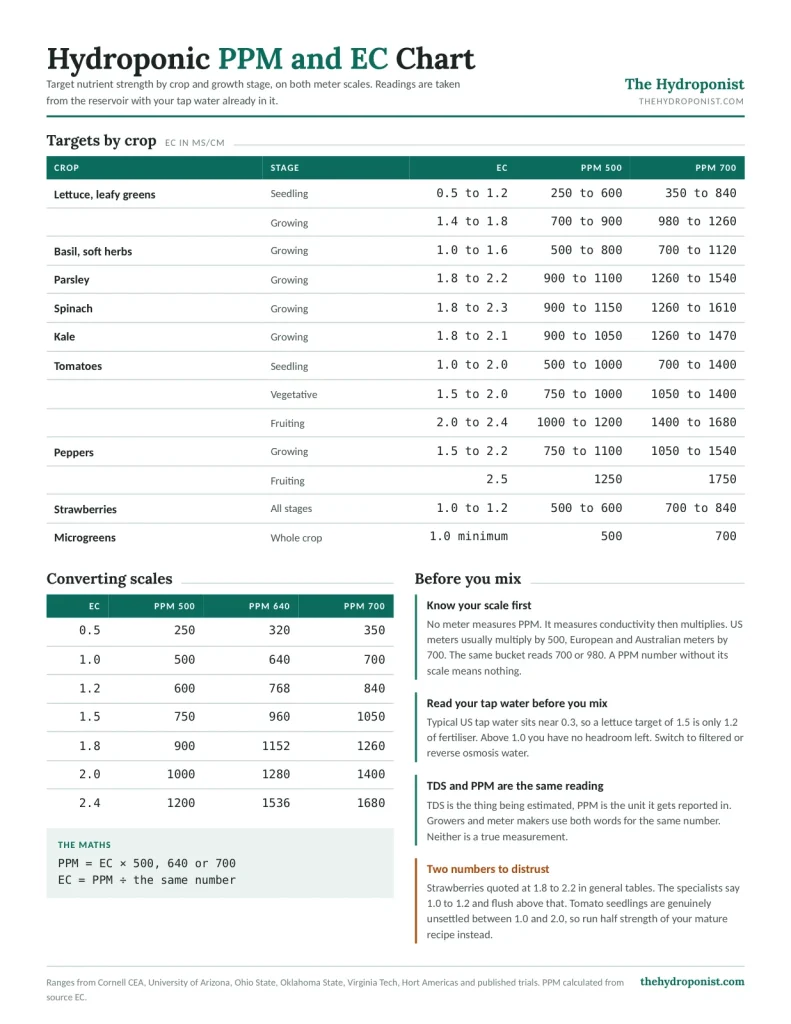
The chart
All EC figures are in mS/cm, which is the same number as dS/m. These are meter readings taken from the reservoir with your tap water already in it. If your meter reads in µS/cm, divide by 1000 first.
| Crop | Stage | EC | PPM 500 | PPM 700 |
|---|---|---|---|---|
| Lettuce and leafy greens | Seedling | 0.5 to 1.2 | 250 to 600 | 350 to 840 |
| Lettuce and leafy greens | Growing | 1.4 to 1.8 | 700 to 900 | 980 to 1260 |
| Basil and soft herbs | Growing | 1.0 to 1.6 | 500 to 800 | 700 to 1120 |
| Parsley | Growing | 1.8 to 2.2 | 900 to 1100 | 1260 to 1540 |
| Spinach | Growing | 1.8 to 2.3 | 900 to 1150 | 1260 to 1610 |
| Kale | Growing | 1.8 to 2.1 | 900 to 1050 | 1260 to 1470 |
| Tomatoes | Seedling | 1.0 to 2.0 | 500 to 1000 | 700 to 1400 |
| Tomatoes | Vegetative | 1.5 to 2.0 | 750 to 1000 | 1050 to 1400 |
| Tomatoes | Fruiting | 2.0 to 2.4 | 1000 to 1200 | 1400 to 1680 |
| Peppers | Growing | 1.5 to 2.2 | 750 to 1100 | 1050 to 1540 |
| Peppers | Fruiting | 2.5 | 1250 | 1750 |
| Strawberries | All stages | 1.0 to 1.2 | 500 to 600 | 700 to 840 |
| Microgreens | Whole crop | 1.0 minimum | 500 | 700 |
Target nutrient strength by crop and growth stage. Sources listed at the foot of this page. Which of these crops can share one tank is a separate question, worked through in what can share a reservoir.
Why your meter and mine disagree
No meter measures PPM. Every meter measures electrical conductivity, which is how well your solution carries a current. To turn that into a PPM number the meter multiplies the reading by a fixed factor, and manufacturers picked different factors.
A meter on the 500 scale assumes your solution behaves like salt water and multiplies by 500. Hanna and most US meters ship this way. A meter on the 700 scale assumes potassium chloride and multiplies by 700. Bluelab and most European and Australian meters use that one. Dip both in the same bucket and both read EC 1.4, but one displays 700 PPM and the other displays 980.
Nothing changed in the bucket. Your solution did not get 40 percent stronger. You are watching the same measurement run through two different multipliers. This is why a PPM number posted in a forum without its scale is useless, and why serious growers just talk in EC.
Converting between scales
| EC | PPM 500 | PPM 640 | PPM 700 |
|---|---|---|---|
| 0.5 | 250 | 320 | 350 |
| 1.0 | 500 | 640 | 700 |
| 1.2 | 600 | 768 | 840 |
| 1.5 | 750 | 960 | 1050 |
| 1.8 | 900 | 1152 | 1260 |
| 2.0 | 1000 | 1280 | 1400 |
| 2.4 | 1200 | 1536 | 1680 |
The maths is simple in both directions. Multiply EC by 500, 640 or 700 to get PPM on that scale. Divide PPM by the same number to get back to EC. A third scale, 640, sits between the two common ones and gets calibrated against mixed fertiliser salts rather than one reference salt. Some sources label it 650. It is the same thing.
Check which scale your meter uses before you trust any number on this page. It is usually printed in the manual as a conversion factor. A factor of 0.5 means the 500 scale.
The step almost every guide skips
Your meter reports total conductivity. It cannot tell the calcium and magnesium already dissolved in your tap water apart from the nutrients you just added. So before you mix anything, fill a cup with plain tap water and take a reading.
Typical US tap water sits around 0.3 mS/cm. Rain water reads close to zero. Hard water can reach 0.8 or higher. That number is your starting line, and it changes what mixing to target actually means.
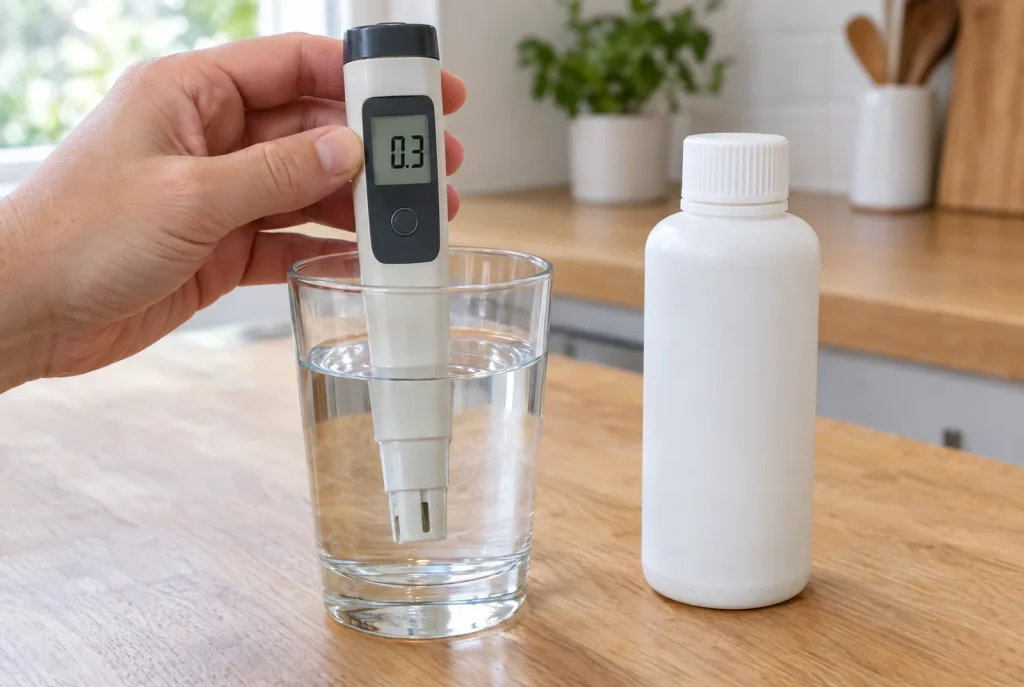
- On 0.3 water aiming for lettuce at 1.5, only 1.2 of that comes from fertiliser. Mix to 1.5 on the meter and you have fed correctly. Add a full 1.5 worth of fertiliser on top of the 0.3 and you land at 1.8, which is twenty percent overfed.
- On hard water at 0.8, a strawberry target of 1.0 to 1.2 leaves almost no room. Your meter says you are on target while the plant has had barely any nutrition.
- The conductivity in tap water is mostly calcium, magnesium, sodium and bicarbonates. Sodium adds to the reading, does nothing useful, and builds up over time.
If your tap water reads above 1.0, switch to filtered or reverse osmosis water for mixing. You have run out of headroom before you started.
Three places the published numbers fight each other
Strawberries
You will find 1.8 to 2.2 quoted for strawberries in general crop tables. Ignore it. Ohio State’s berry production centre, Hort Americas and the University of Arizona all land on 1.0 to 1.2, and Ohio State flushes the root zone once it climbs past 1.2. Strawberries are salt sensitive and the higher figure will hurt them. Start at 1.0.
Tomato seedlings
Ohio State runs young tomatoes near 2.0. Arizona runs them near 1.0. That is a genuine twofold disagreement between two good sources and nobody has settled it. If you are new, take Ohio State’s shortcut instead of picking a side. Run half strength of your mature recipe for the first stage and three quarters for the second.
Basil
Iowa State grew basil across a range from 0.5 all the way to 4.0 and found no meaningful effect on growth. Light mattered far more. Treat the basil row above as a comfortable window rather than a target to chase, and put your effort into your lighting instead.
Watch the other kind of PPM
Nutrient recipes sometimes specify something like 150 PPM nitrogen. That is not the same quantity as the PPM on your meter. Meter PPM estimates everything dissolved in the water. Recipe PPM specifies one single element. Converting between them is meaningless, and mixing them up is one of the most common errors in hydroponics content.
TDS or PPM
TDS means total dissolved solids, which is the thing being estimated. PPM means parts per million, which is the unit it gets reported in. In practice growers use both words for the same reading and so do meter manufacturers. Neither is a true measurement. A real TDS test means evaporating a sample and weighing what is left behind.
Using the chart day to day
- Read your tap water and write the number on the reservoir in marker.
- Mix to the target for your crop and stage using the nutrient dosing calculator to work out quantities.
- Check the reading again once everything has dissolved and circulated for an hour.
- Test every two or three days. A rising number means the plants are drinking water faster than they are eating, so top off with plain water. A falling number means the opposite.
- Set your pH after you set your nutrient strength, never before, because adding nutrients moves it. The pH guide covers that order.
If the numbers look right and the plants still look wrong, the problem is somewhere else. Start with troubleshooting.
Crop guides
For everything beyond nutrient strength, each crop has its own page. Lettuce, herbs, tomatoes and peppers and strawberries. New to mixing altogether? Start with hydroponic nutrients 101, or see which bottles we rate in best hydroponic nutrients.
Frequently asked questions
What PPM should hydroponic lettuce be?
Growing lettuce sits at EC 1.4 to 1.8, which is 700 to 900 PPM on the 500 scale or 980 to 1260 PPM on the 700 scale. Seedlings run lower, at EC 0.5 to 1.2.
Why do two meters show different PPM in the same water?
No meter measures PPM directly. Every meter measures electrical conductivity then multiplies it by a fixed factor. The 500 scale multiplies by 500 and the 700 scale multiplies by 700, so the same EC of 1.4 displays as either 700 or 980 PPM depending on the meter.
How do you convert EC to PPM?
Multiply EC in mS/cm by 500, 640 or 700 depending on which scale your meter uses. To go the other way, divide the PPM reading by the same number.
Is TDS the same as PPM?
TDS means total dissolved solids, which is the thing being estimated. PPM means parts per million, which is the unit it is reported in. Growers and meter makers use both words for the same reading.
Should you subtract tap water EC from your reading?
Measure your tap water before mixing. Typical US tap water reads about 0.3 mS/cm, so on a lettuce target of 1.5 only 1.2 comes from fertiliser. If your tap water reads above 1.0 you have no headroom left and should mix with filtered or reverse osmosis water.
Where these numbers come from
Ranges are drawn from university extension and controlled environment research rather than product marketing. Lettuce from Cornell’s CEA Lettuce Handbook, the University of Arizona and Oklahoma State. Tomatoes from Ohio State and Arizona. Peppers from Hort Americas and Oklahoma State. Strawberries from Ohio State’s Controlled Environment Berry Production centre and Hort Americas. Kale from published trials in Agronomy. Microgreens from Virginia Tech Extension. Herbs and spinach from Oklahoma State, with the basil trial from Iowa State.
Spinach appears in one source only, so treat that row as less settled than the rest. PPM figures are calculated from the source EC values, since almost no research publishes PPM directly.